Just the Facts - Racial Disparities and Incarceration Rates
Over 80 percent of all arrests are for low-level, non-violent offenses and conduct related to poverty.

As of Spring 2021, more than 1.8 million people reside in U.S. jail systems. After decades of incarceration growth, 2021 finally saw a reduction in the prison population, with COVID reduction policies largely accounting for the decrease. However, the decline of incarcerated persons nationally doesn't tell the story of significant increases among different state and local prison populations. Rates decreased in urban communities, but increased in more rural areas across the country.
The national decline also doesn't shed any light on the racial disparities with the U.S. incarceration rates. At this point, the over-representation of Black men in the prison system is well documented. Black men constitute about 13 percent of the male population in the United States, but about 35 percent of those incarcerated. One in five Black people born in 2001 is likely to be incarcerated in their lifetime, compared to one in 10 persons of Latino descent and one in 29 white people. Nationally, Latinx people are also overrepresented in prisons and jails, yet common data misclassification leads to distorted, lower estimates of Latinx incarceration rates and distorted, higher estimates of white incarceration rates. Smaller and inconsistent data reporting make it difficult to measure the effects of racism for incarcerated people of other racial groups.
The 10 states with the highest incarceration rates:
- Louisiana - 684 persons per 100,000 people
- Mississippi - 639 persons per 100,000 people
- Oklahoma - 632 per 100k
- Arkansas - 582 per 100k
- Arizona - 536 per 100k
- Kentucky - 514 per 100k
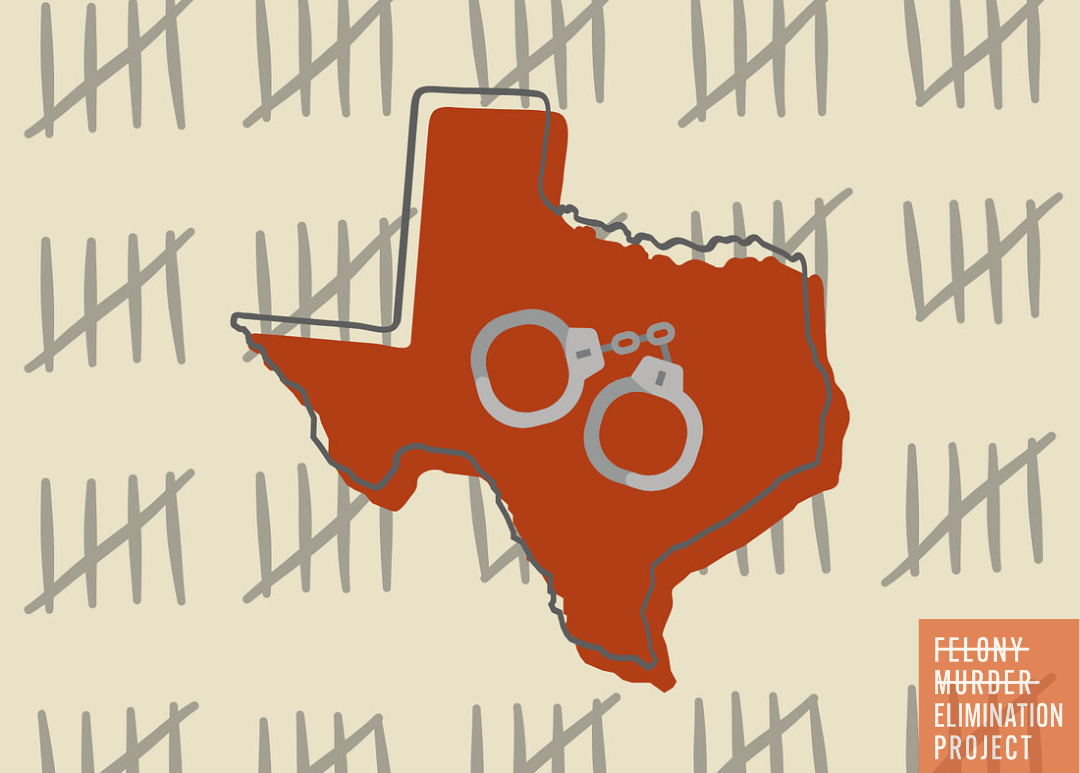
- Texas - 513 per 100k
- Georgia - 495 per 100k
- Idaho - 452 per 100k
- Florida - 433 per 100k
Black men constitute about 13 percent of the US male population, but about 35 percent of those incarcerated. So, in revisiting the list of the top ten states by rate of incarceration:
- Louisiana - Black people are 33% of state residents, 67% of people in prison.
- Mississippi - Black people are 39% of state residents, 62% of people in prison.
- Oklahoma - Black people are 8% of state residents, 25% of people in prison.
- Arkansas - Black people are 16% of state residents, 41% of people in prison.
- Arizona - Black people are 5% of state residents, 14% of people in prison.
- Kentucky - Black people are 9% of state residents, 21% of people in prison.
- Texas - Black people are 13% of state residents, 33% of people in prison.
- Georgia - Black people are 32% of state residents, 60% of people in prison.
- Idaho - Black people are 1% of state residents, 3% of people in prison (additionally, Latinos make up 12% of state residents but 16% of people in prison; Native Americans 1% of state residents and 4% of people in prison)
- Florida - Black people are 14% of state residents, 47% of people in prison.
White persons are under-represented in the prison population of every single U.S. state.
This is just a small part of the illuminating look at overall incarcerations trends and the result of ongoing work from The Vera Institute of Justice. You can view the interactive map above and other data in their Incarceration Trends study.